Moving b in a Quadratic Equation
by
Rob Walsh
A quadratic equation is a second degree polynomial with at most three terms and two roots. It's graphic representation is parabolic in shape and by definition, is the locus of points that is equidistant from a given point (known as the focus) and a line (known as the directrix.). Constructions of certain parabolas have led to the common standard equation representation y = ax2 + bx + c, where x and y are the coordinates for each of the locus points and a, b, and c are parameters that describe the parabola's shape and location on the Cartesian Plane. If we fix our y value to zero, then some minor exploration shows us how parameter a and parameter c define a parabola. However, in this investigation, we are interested in how different values for b change a parabola's shape.
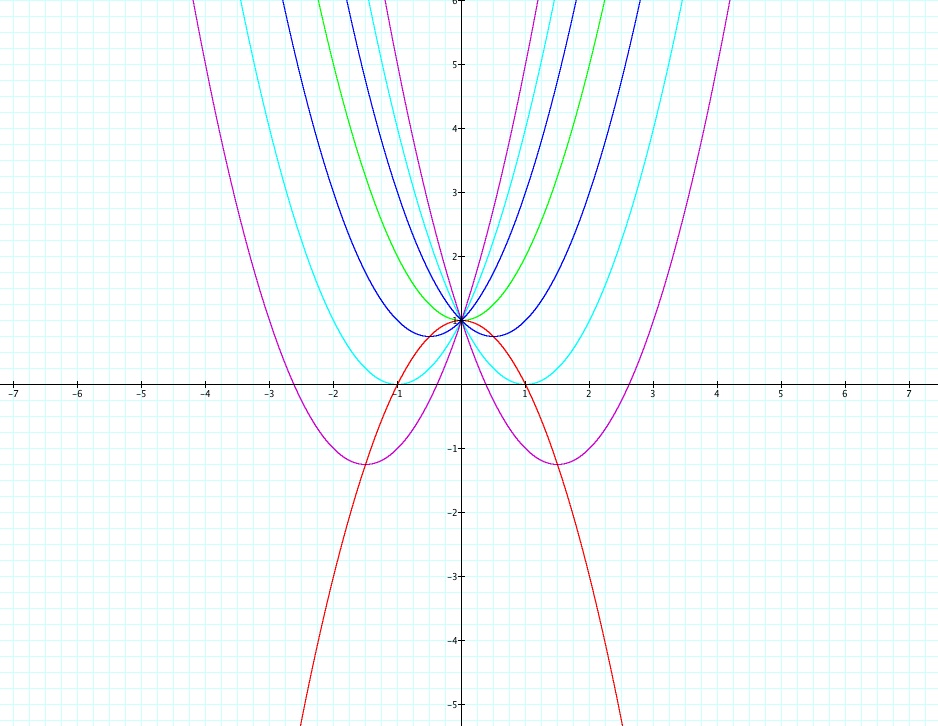
We explore y = x2 + bx + 1, where a and c are held constant. Let's graph this quadratic for b = -3, -2, -1, 0, 1, 2, 3.
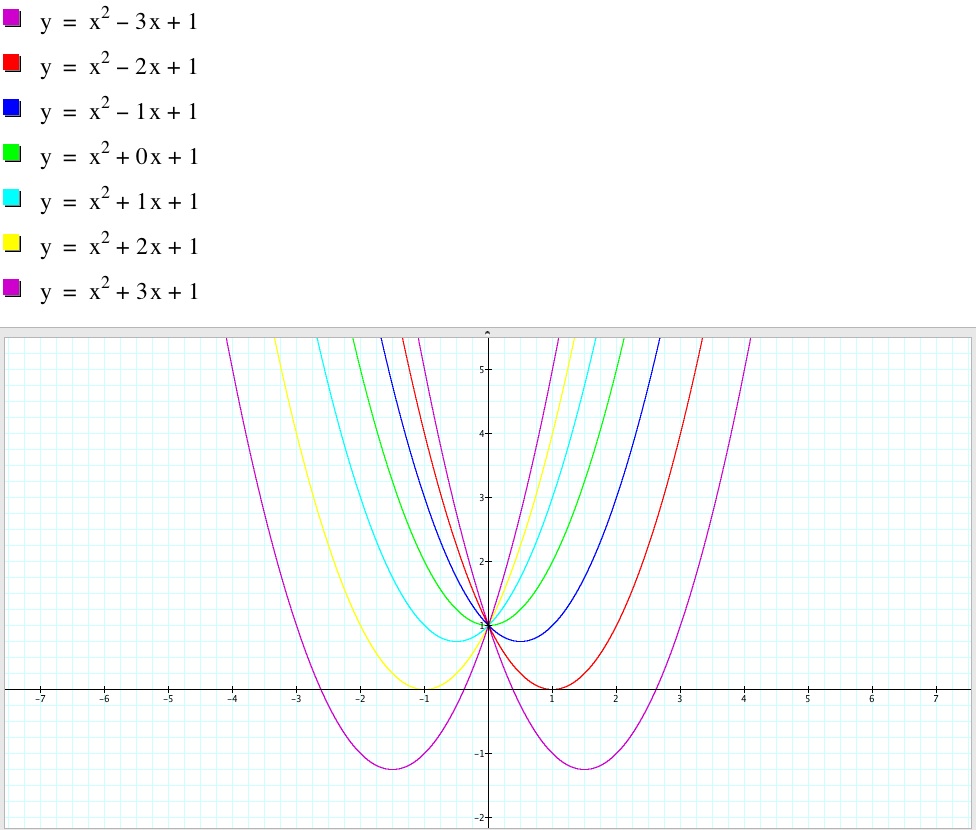
There are a few things of interest here:
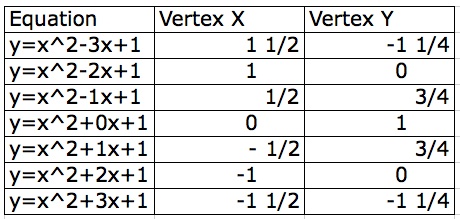
If we plot these coordinate pairs, the vertices start to take a very obvious shape:
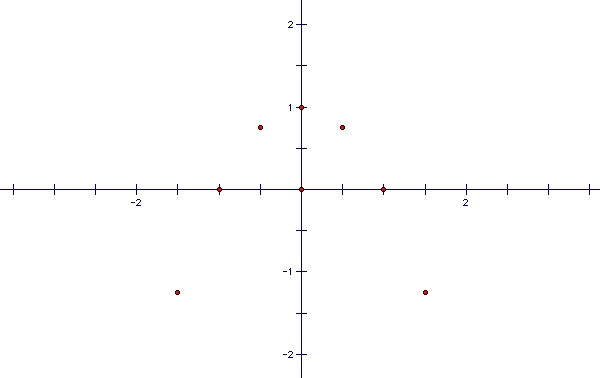
If we consider the locus of the vertices of the set of parabolas graphed from y = ax2 + bx + c, what we find is that we get a parabola that opens opposite of our set:
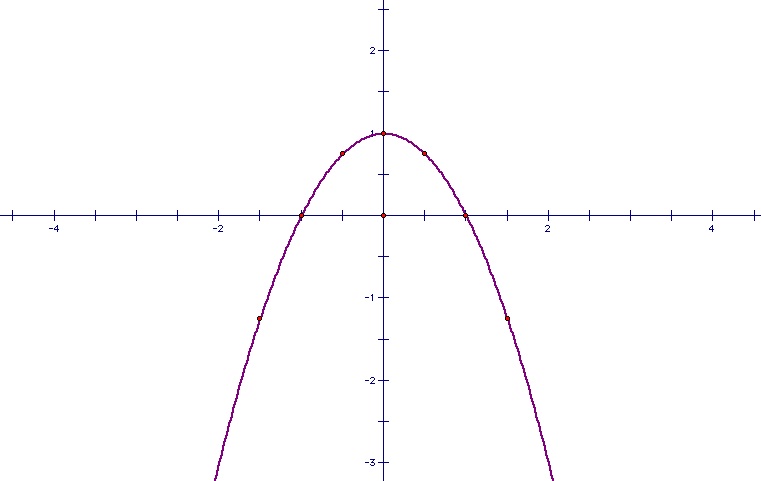
Let's finish off by finding out the equation of this locus. We start with the general equation y = ax2 + bx + c where we know that our values for a and c are both 1. In our locus graph, since it opens opposite our set of parabolas, we take the opposite of a. We can further see why c = 1, because it is our y-intercept (when x = 0) and therefore, all terms with a variable x go to zero. Now, we have y = -x2 + bx + 1. What is left to figure out is our value for b. Recall, that the x-coordinate of a parabola's vertex is found by taking -b/2a. In this case, this value is 0 and we already have that a = -1. So, we can solve for b as follows:
x = -b/2a
0 = -b/2(-1)
0 = -b/-2
(0)(-2) = -b
0 = -b
So, we can generalize the equation of this locus to be the parabola y = -x2 + 1.
One final observation is that the vertex of our locus is the one common point of our set of parabolas. Therefore, we can further generalize the locus equation as such:
Given a uniform set of equations y = ax2 + bx + c, we determine the equation of the locus of their vertices to be y = dx2 + ex + fx, where d = -a, e is the x-coordinate of the sets common intersection point and f is the y-coordinate of the common intersection point. Let's observe one more time!